Visualise results
Visualise results
Instructions
Run the simulation with post processing as shown here.
Run simulation and output to default location
gerber2ems -a- Results of post processing should be stored in
ems/results/*.csv. - Graphs should be stored in
ems/graphs/*.png. - The
emsfolder is controlled by the--outputargument togerbvwhich is explained here
Post processed results
- S parameters are calculated for all excited ports.
- Impedance of signal trace or differential pair is calculated.
Propagation delay
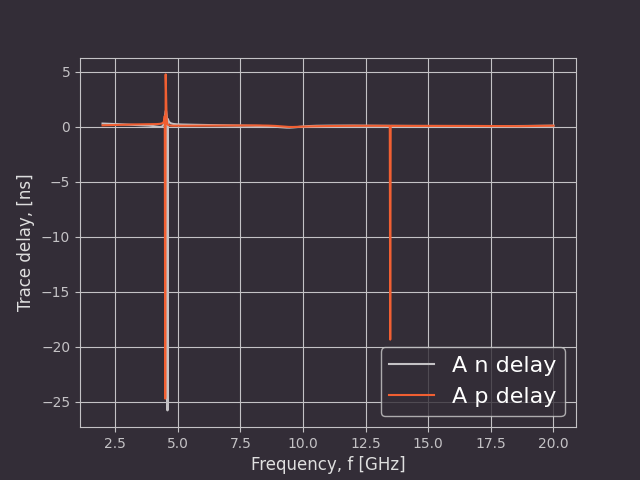
Figure 7. Propagation delay of differential pairs
S-parameters
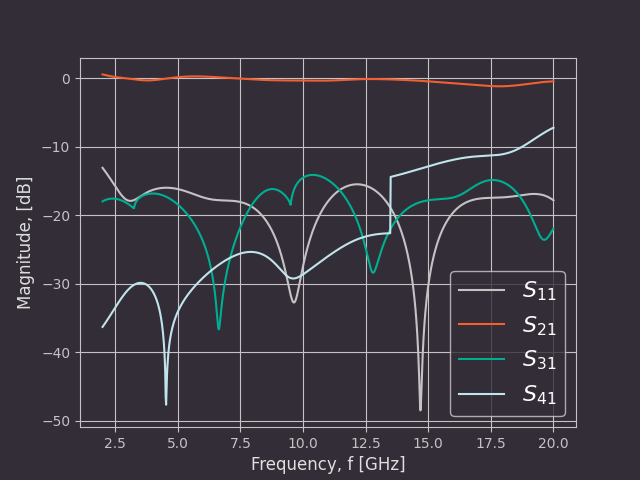
Figure 8. S parameters for port 1
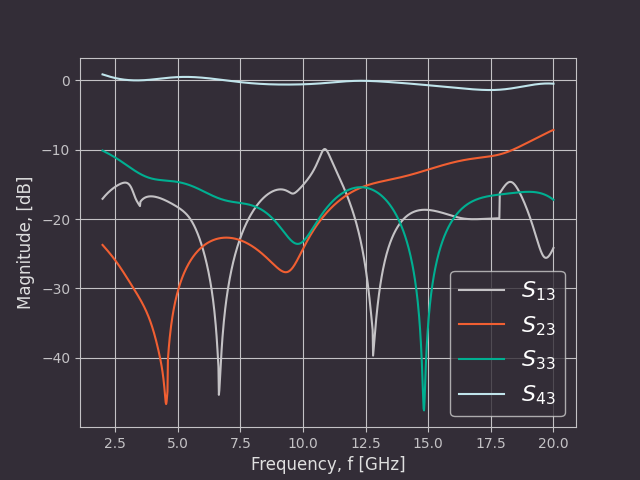
Figure 9. S parameters for port 3
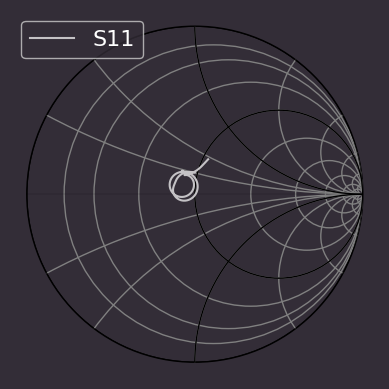
Figure 10. Smith chart for S11 parameter
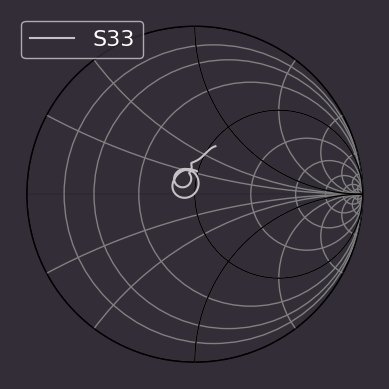
Figure 10. Smith chart for S33 parameter
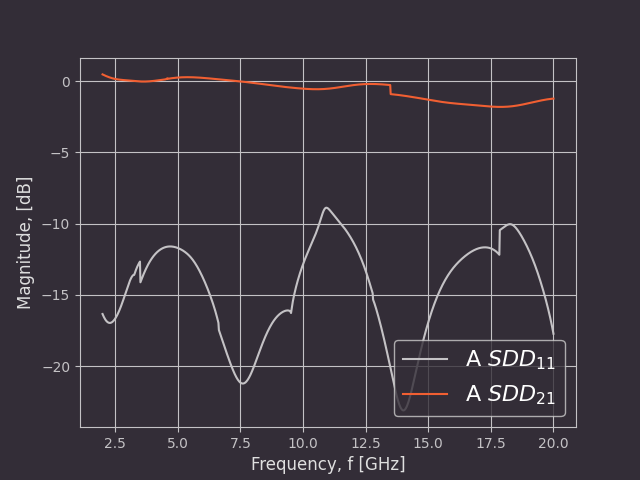
Figure 11. Differential pair S parameters
Characteristic impedance
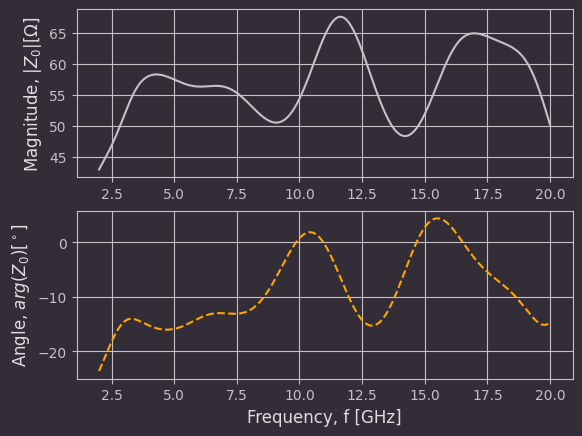
Figure 12. Impedance of differential pair trace 1
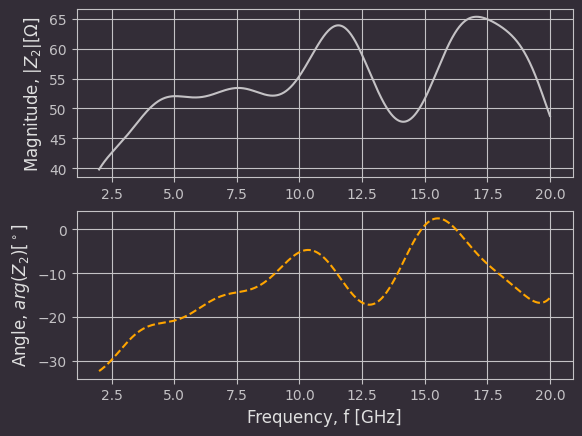
Figure 13. Impedance of differential pair trace 3
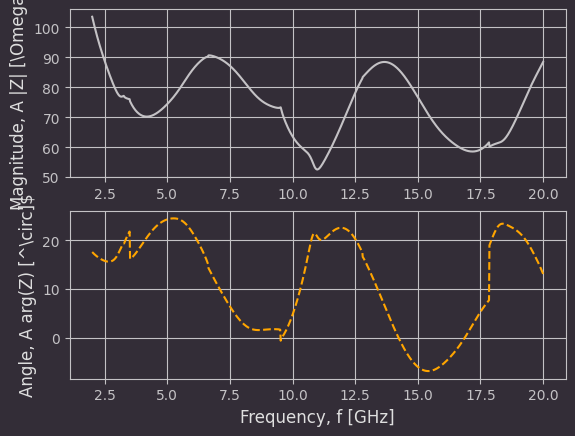
Figure 14. Combined impedance of differential pair